In the age of data-driven football, heatmaps are among the most widely used and misunderstood tools in the analyst’s toolbox. Whether it’s for scouting, match analysis, or opposition preparation, these colorful visuals are often taken at face value. But behind the warm tones and eye-catching gradients lies a more nuanced reality.
This article explores what heatmaps in football truly communicate, how they can be used effectively, and why they must always be interpreted in context.
What Is a Heatmap?
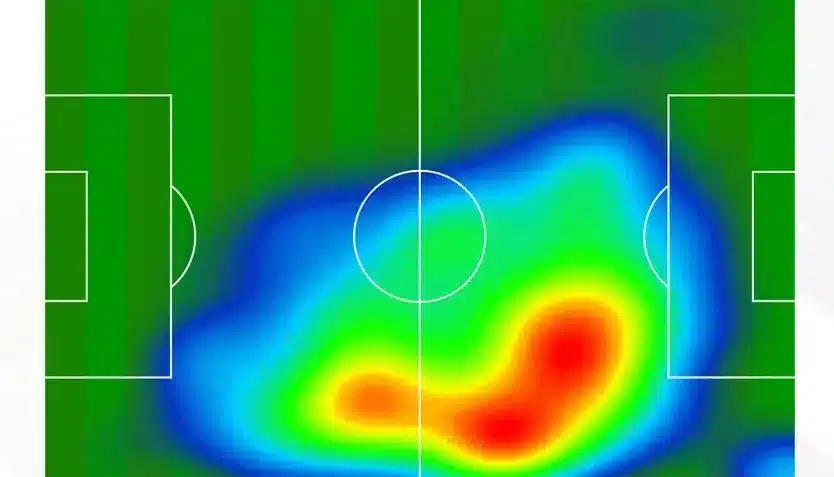
A heatmap is a graphical representation of data that uses color gradients to show how often something occurs in different areas of the pitch. In football, heatmaps typically track:
- Player activity zones
- Team collective positioning
- Frequency of events (touches, passes, duels, etc.)
The warmer the color (red/orange), the more activity or frequency is recorded in that area. Cooler tones (blue/green) indicate lower activity.
But not all heatmaps are created equal. Depending on the data source, the metric being visualized, and the method of tracking, heatmaps can tell different stories.
Types of Heatmaps and What They Represent
1. Touch-Based Heatmaps
These are the most common and represent where a player touches the ball during a game. They’re often generated by event data providers like Opta, Wyscout, or StatsBomb.
What they show:
- Areas of ball involvement
- Tactical roles and zones of influence
Limitations:
- Ignore off-ball movement
- No indication of what the player did after receiving the ball
2. Tracking-Based Heatmaps
Generated from GPS or optical tracking systems, these map a player’s location on the pitch over time, regardless of whether they are on the ball.
What they show:
- True positioning over time
- Defensive and off-ball work rate
- Positional discipline and transitions
Limitations:
- Require sophisticated hardware or stadium setup
- Often unavailable to grassroots and lower-league analysts
3. Event-Specific Heatmaps
These display where specific actions take place—like progressive carries, passes received, or duels won.
What they show:
- Tactical tendencies (e.g., where a midfielder likes to receive under pressure)
- Zone-specific action trends
- Functional roles (e.g., who delivers crosses from deep, who attacks second balls)
Limitations:
- Must be read in relation to player role, opposition shape, and game model
What Heatmaps Do Tell You
1. Zones of Activity
Heatmaps reveal the areas where a player or team is most active. This is particularly useful for identifying:
- Players’ preferred zones
- Tactical flexibility or rigidity
- Structural occupation (e.g., width, depth, centrality)
For example, an inverted fullback will show activity in central corridors, whereas a traditional winger will have a wide and vertical heat signature.
2. Tactical Roles and Responsibilities
Player heatmaps help analysts infer tactical instructions. A few examples:
- A center-forward drifting into the left half-space may be creating space for an underlapping fullback or inside forward.
- A defensive midfielder with minimal activity in the final third likely has positional responsibilities tied to balance and ball recovery.
Heatmaps give clues about how players interpret roles within the team’s positional play or transition principles.
3. Team Shape and Structural Tendencies
When viewed collectively, team heatmaps can offer:
- Insights into pressing zones and intensity
- Clarity on block height (low, mid, high)
- Lopsided build-up patterns or overloads
- Defensive compactness or vertical stretching
In opposition analysis, this can be invaluable. For example, if the opposing team shows consistent heat concentration on the right flank, a coach might look to exploit their weaker left side in transition.
What Heatmaps Don’t Tell You
1. Decision-Making and Game Intelligence
Heatmaps don’t show the why or when of a player’s actions. For instance:
- Did the player move into space at the right time?
- Were their movements coordinated with teammates?
- Did they receive in advantageous moments or under pressure?
These questions require time-sequenced data and, most often, video analysis to answer.
2. Action Quality or Outcome
A central midfielder may have extensive touches near the halfway line—but were they safe passes backward? Or line-breaking switches? Heatmaps can’t:
- Assess the value of actions
- Differentiate between a key pass and a square ball
- Show outcomes like chance creation or possession losses
To measure quality, heatmaps must be used alongside event data (e.g., xT, xGChain, progressive metrics).
3. Off-Ball Influence Without the Ball
In football, space creation is often about what you do without the ball—making decoy runs, blocking lanes, pressing triggers. Heatmaps based on touches ignore:
- Support runs
- Cover shadows
- Positioning in defensive transitions
This is especially limiting when analyzing wingers, pressing forwards, or holding midfielders whose job is as much about control and support as possession.
How to Use Heatmaps Effectively in Analysis
Scouting
Heatmaps help identify positional tendencies and heat zones. They are useful for spotting how and where a player prefers to operate. However, they should be combined with video clips, radar stats, and context about the player’s team style to understand whether those tendencies are effective or suitable for a new tactical environment.
Match Analysis
Heatmaps offer insight into roles, player involvement, and team structure during different phases of play. To make full use of them, pair with timeline data and key events (such as pass networks, expected threat progression, or chance creation) to understand both spatial and tactical implications.
Team Strategy
Heatmaps help visualize pressing zones, build-up preferences, compactness, and structural tendencies. When evaluating a team’s strategy, add complementary visuals like pass maps, average positions, or player movement tracks to get a more complete tactical picture.
Opposition Preparation
Use heatmaps to spot patterns in an opponent’s behavior—such as consistent use of one flank, central overloads, or areas they leave unprotected in transition. Always add context on the opposition’s game model, common shape, and player profiles to avoid misleading conclusions.
Common Misinterpretations
- “Red = Good” Fallacy
Just because a player has a red-hot area doesn’t mean they were effective there. A center-back could have 100 sideways passes in that zone—yet contribute little in progression. - Overemphasis on Symmetry
Coaches may mistakenly assume asymmetrical heatmaps indicate poor structure. In reality, asymmetry is often deliberate—for example, overloading one side to isolate a 1v1 on the other. - Ignoring Game State
A player’s heatmap from a match where their team dominated 70% possession will look very different than one from a low-block defensive battle. Game context is crucial.
Final Thoughts: What Heatmaps Really Tell You
Heatmaps are a valuable visual snapshot of player behavior and tactical structure—but only when interpreted correctly.
They can show:
- Where a player operates
- How a team builds or defends
- Spatial control and activity zones
But they cannot show:
- Tactical execution quality
- Decision-making and tempo
- Movement off the ball or influence on others
In short: heatmaps show you where football happens—not how well it’s played. For a complete picture, they must be combined with match footage, event metrics, and tactical understanding.