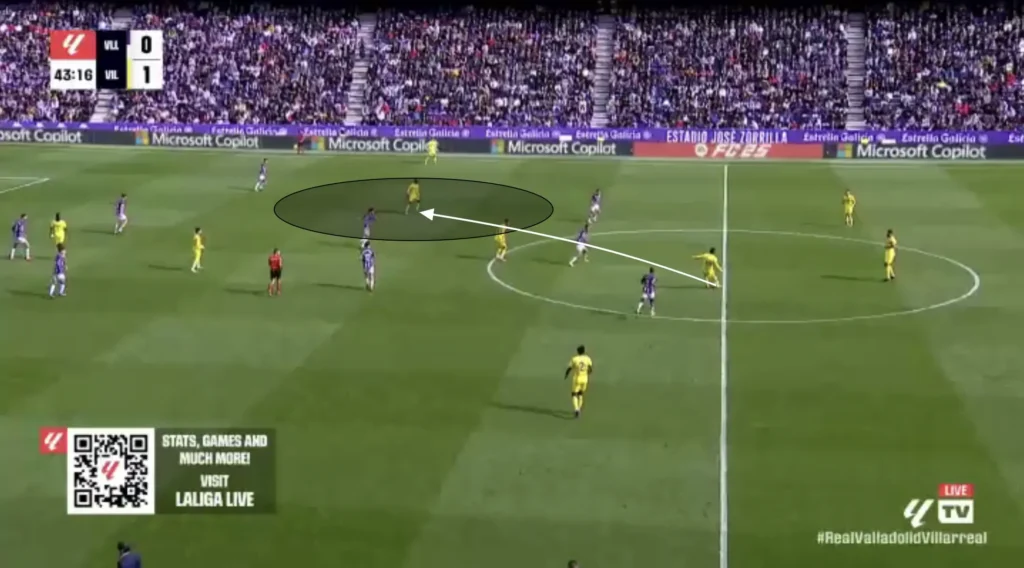
In today’s football landscape, data is everywhere — from simple pass completion stats to advanced models like expected goals (xG). But while many metrics tell us what happened, very few answer a more important question: how valuable was that action in increasing the chance of scoring? This is where Possession Value (PV) comes in. It’s a framework for quantifying the true impact of each on-ball action during a possession, helping coaches, analysts, and players understand the quality, not just the quantity, of involvement.
Let’s break down what PV is, how it works, and how it’s used across the modern game.
What Is Possession Value?
Possession Value (PV) is a metric that estimates how much each action — such as a pass, dribble, or carry — increases (or decreases) a team’s probability of scoring a goal during that possession sequence.
Unlike traditional stats that evaluate isolated events (e.g., successful pass, shot on target), PV puts actions in context. It focuses on what comes next — measuring how an action contributes to a valuable attacking sequence over time.
You can think of it as asking: “If this action hadn’t occurred, would the chance of scoring later have been lower?”
This approach allows analysts to differentiate between actions that look good and actions that create actual value.
How Does PV Work?
The basic logic of Possession Value involves three core steps:
- Segment the match into possessions. A possession is typically defined as the period during which one team controls the ball until it loses it via turnover, shot, or stoppage.
- Assign a value to each action based on its impact on scoring probability. Using machine learning models and historical data, each pass, carry, or dribble is given a value depending on how much it changes the likelihood of a goal.
- Track value progression across the sequence. By comparing the team’s scoring probability before and after the action, the PV model outputs a numerical value that reflects the positive or negative contribution of that moment.
A Simple Example
Imagine a holding midfielder receives the ball near the halfway line and plays a diagonal forward pass to an attacking midfielder that breaks the opposition midfield line. That one pass alone might not create a shot — but it shifts the team into a more dangerous zone.
Before the pass: 2.5% chance of scoring
After the pass: 4.8% chance of scoring
Possession Value of the pass: +2.3%

Now compare that with a safe backward pass under no pressure. It might retain possession but not increase scoring probability — and thus have close to zero PV.
PV vs xT vs xG Chain
Possession Value is often confused with other metrics like Expected Threat (xT) or xG Chain. Here’s a quick breakdown of how they differ:
- xT (Expected Threat): Focuses on zones of the pitch. It tells you how likely a team is to score from different areas. Useful for spatial analysis.
- xG Chain: Focuses on player involvement. It attributes xG to everyone involved in a build-up, not just the assist or shooter.
- Possession Value (PV): Focuses on the action. It looks at how each pass, dribble, or carry contributes to increasing the team’s scoring probability.
In short:
xT tells you where danger is.
xG Chain tells you who was involved.
PV tells you what created value.
Applications of Possession Value
PV isn’t just a scouting tool. It can be applied across nearly every area of the game:
1. Performance Analysis
Analysts use PV to assess which players regularly increase the probability of scoring — not just through assists and shots, but through progressive actions that lead to dangerous situations. It allows for deeper understanding of player contributions within team patterns and gives a clearer sense of efficiency in build-up play.
2. Tactical Planning
By mapping which zones and types of actions create the most value, coaches can tailor game plans accordingly. For example, if certain diagonal switches consistently generate high PV, a team might look to build patterns to exploit that more frequently. Likewise, it can reveal if build-up sequences are sterile or genuinely threatening.
3. Player Development
Young players who make smart but simple value-adding decisions (e.g., turning into space, switching the play, or playing through pressure) are often overlooked in traditional metrics. PV helps highlight players who may not rack up goals or assists but are key to their team’s attacking process. Coaches can also track individual PV trends over time to identify improvement or decline.
4. Opposition Analysis
Opposition analysts can use PV to identify which players are most responsible for value creation — not necessarily the final pass or shot, but those earlier in the sequence. Neutralizing high-PV players can be more important than marking the top scorer. PV also helps identify dangerous areas, transitions, and patterns from the opposition that may not show up in traditional stats.
Key Insights from PV
- Not all passes are equal. A sideways pass under no pressure may complete safely but adds little value. A vertical or diagonal pass through pressure that breaks lines often carries a higher PV.
- Risk and reward go hand in hand. Some players are high-PV but also high-turnover. Understanding this trade-off is crucial when evaluating whether a player fits a team’s risk profile or playing style.
- “Invisible” contributors are revealed. Holding midfielders or fullbacks initiating build-up actions often go uncredited. PV highlights their impact on attacking sequences even if they aren’t directly involved in the final shot.
- PV can detect ineffective possession. A team might dominate possession but show low cumulative PV — indicating sterile circulation without much threat. On the flip side, a counter-attacking team might have lower possession but much higher PV per action.
Limitations of Possession Value
As with all models, PV has some drawbacks:
- Depends on model design. There’s no universal PV model. Different providers (like StatsBomb or Opta) may have different definitions, training data, and outcome assumptions, leading to slightly different outputs.
- Can favor dominant teams. Players in top teams get more touches in high-value areas, inflating their PV numbers. Normalizing for team context is key when comparing players across levels.
- Doesn’t account for defensive actions. While PV is great for analyzing ball progression, it doesn’t directly measure defensive work unless it leads into a new attacking sequence.
What’s Next for PV?
Possession Value is already making its way into recruitment, opposition scouting, and performance dashboards at top clubs. The next frontier involves:
- Defensive PV models: Estimating how much certain defensive actions reduce the opponent’s scoring probability.
- Real-time insights: Live PV feedback during matches could shape tactical decisions and substitutions.
- Player-specific models: Tailoring PV calculations to account for player roles, team tactics, and opposition quality.
As clubs, federations, and analysts continue to adopt smarter data frameworks, Possession Value is likely to become a cornerstone of performance insight — not just for top-tier clubs, but also for ambitious teams lower down the football pyramid.
Conclusion
Possession Value goes beyond surface-level stats to measure what really matters: how much each action contributes to scoring potential. It gives coaches a tool to optimize team patterns, helps analysts identify key contributors, and provides players with a framework to improve decision-making.
Because in modern football, it’s not just about what you do — it’s about how much you move your team closer to a goal.
