
Football is more than just goals and assists. The best players often impact matches long before the final shot. That’s why modern analytics go beyond traditional statistics—to measure how players influence attacking play throughout the build-up. One of the most useful metrics for doing this is Expected Threat (xT).
Expected Threat evaluates how a player’s actions—especially passes, dribbles, and carries—increase the likelihood of a goal. While Expected Goals (xG) focuses on the shot itself, xT values everything leading up to it. In this article, we’ll break down what xT is, how it works, how analysts and coaches use it, and how it compares to other common metrics.
What Is Expected Threat (xT)?
Expected Threat (xT) is a football metric that estimates how dangerous the ball’s position is at any given moment. It assigns a value to different areas of the pitch based on how likely a goal is to occur from that location—or shortly after the ball arrives there.
Rather than judging players only by goals and assists, xT tracks how much each action increases the team’s chances of scoring. If a player passes the ball into a more threatening area, their xT contribution goes up. If they simply move the ball sideways or backwards, the xT might stay the same or even decrease.
Put simply, xT answers this question:
How much closer to scoring did this action bring the team?
How Does xT Work?
To calculate xT, analysts divide the pitch into a grid—commonly 12×8 or 16×12 zones. They assign each zone a base xT value, based on historical data showing how often teams score after getting the ball into that area.
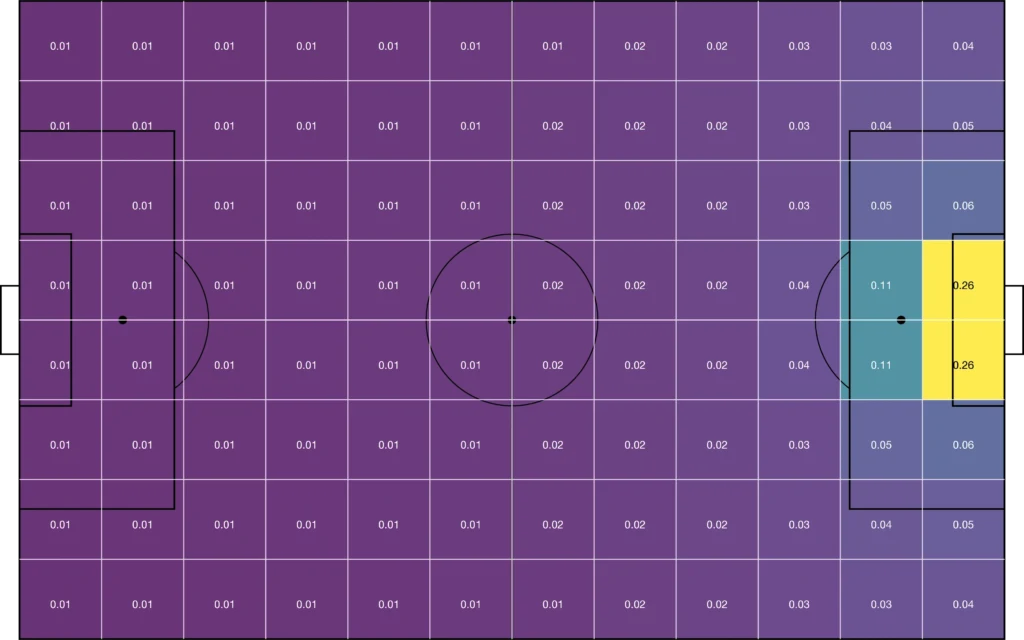
Every time a player completes an action (pass, dribble, or carry), the model measures the difference between the xT value at the start and the end of that action. This difference becomes the xT value of the action.
Example:
A midfielder passes from a low-threat area (xT: 0.01) into the edge of the box (xT: 0.10). The xT for the pass equals:
0.10 – 0.01 = 0.09
That means the player increased the team’s chances of scoring by 9% with that single action.
Formula:
xT = xT(end location) – xT(start location)
The model then tracks each player’s contributions over the course of a game, a season, or even a career—helping analysts understand who consistently creates danger.
Why Use xT?
xT adds depth to football analysis by highlighting the players who help create chances, not just the ones who finish them. It recognizes players who progress the ball effectively and consistently put their teams in better positions to score.
Here’s what xT helps you do:
- Spot playmakers who create space and open up defenses
- Compare players who operate in different positions or systems
- Understand team build-up and where the threat originates
- Track progression over time, even when players aren’t scoring or assisting
xT captures the value of actions that often go unnoticed—making it especially useful for evaluating midfielders, wide players, and fullbacks who contribute heavily to build-up play.
How Teams and Analysts Use xT
1. Scouting and Recruitment
Clubs use xT to find players who consistently create danger, even if they don’t appear at the top of goal or assist charts. A player in a weaker team might have low xG or few assists—but if their xT numbers are high, they’re likely progressing the ball into valuable areas with intelligence and consistency.
xT also helps analysts spot under-the-radar talents, especially in youth academies or lower leagues where traditional stats can be misleading.
2. Tactical Insights
Coaches and analysts use xT heatmaps to spot patterns. They can see which areas of the pitch a team exploits best, or where they struggle to create threat. For example, a team might create high xT on the right flank but not the left—indicating an imbalance in their attacking structure.
Analysts also use xT to assess how tactical changes affect chance creation. Did a substitution or formation switch lead to higher threat levels? xT helps answer that question.
3. Player Development
xT gives coaches a way to measure progress for young players or those in development roles. If a fullback starts carrying the ball into the final third more often, their xT contribution will rise—even if they’re not delivering assists yet.
By tracking xT over time, coaches can measure a player’s growing influence in the attacking phase.
Comparing xT and xG
xT and xG serve different purposes in football analysis:
- Expected Goals (xG) measures the chance of a goal from a specific shot.
- Expected Threat (xT) measures how much a non-shooting action increases the chance of scoring.
Here’s a simplified comparison:
| Metric | Focus | Actions Measured | Useful For |
|---|---|---|---|
| xG | Shot quality | Shots only | Evaluating finishers |
| xT | Build-up and progression | Passes, dribbles, carries | Evaluating playmakers and ball progressors |
xG rewards the final act. xT rewards the process that leads up to it.
Limitations of xT
Like any model, xT isn’t perfect. Here are a few limitations to keep in mind:
- It doesn’t account for defensive pressure or the context of a match.
- It assumes all players are equally likely to finish chances from the same position (which isn’t true in reality).
- It ignores unsuccessful actions—focusing only on completed passes and carries.
- Different providers use slightly different xT models, so numbers may vary depending on the source.
Still, when paired with video, xG, and player-specific context, xT remains one of the most powerful tools for understanding attacking contribution.
Conclusion
Expected Threat (xT) helps us look beyond goals and assists to see which players drive their teams forward, consistently moving the ball into high-value areas. It rewards intelligent movement, progressive passing, and smart decision-making—qualities that often go unnoticed in traditional statistics.
Whether you’re scouting talent, analyzing team shape, or breaking down individual performances, xT gives you a clearer picture of how football is played and where chances come from.
As the game continues to evolve, so will the data behind it. But one thing is clear: xT is here to stay—and it’s changing how we understand threat on the pitch.
Such an amazing and useful article, especially for us young people that want to get into football analytics!